|
|
|
|
|
|
|
|
|
|
|
|
|
|
|
|
 |
 |
| January 26th,
2005: Albion Test Fishery Sturgeon Catch Report
From Troy Nelson, Fraser River Sturgeon Conservation Society:
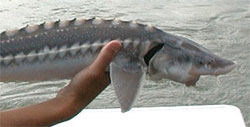
Please find this workbook with 3 charts of sturgeon catch from the Albion test fishery. As previously presented, the abundance of white sturgeon observed in the Albion test fishery over a season (April through November) strongly suggests repetitive, intra-annual migrations of sturgeon in the lower Fraser River. The bimodal abundance (spring and late summer/fall) of sturgeon observed in the test fishery suggests downstream migrations from (overwintering locations) past the test fishing site (river km 58) in the spring (eulachon spawning) and upstream migrations in the late summer/fall (to feed on salmon roe/carcasses - earlier in pink salmon years - and to overwintering locations). Beyond illumination of white sturgeon movement/migration patterns in the lower Fraser, it is possible that sturgeon catch data from the Albion test fishery, which is available back to 1980, could be used to test for changes in lower Fraser sturgeon stock abundance over time. The first chart presents the catch of white sturgeon in the Albion test fishery, by month, by year, over the past 5 years (2000-2004). The data for this chart varies slightly from summary charts provided in the past; these data (from Fisheries and Oceans Canada) are for the "assessment only" net sets from the test fishery, whereas in the past I used data from the FRSCS monitoring program (number of sturgeon sampled). The two data sets are very similar, however the "assessment only" data presented is the number of sturgeon captured, regardless of if the fish was sampled or not, during the assessment net sets only. The use of these data provides the best comparisons to test for changes in abundance over time. For most of the data presented here (2000-2004), there is additional tag release, recapture, and size (fork length) data available from the FRSCS monitoring and assessment data base (recapture and size information could also be used to changes in population structure). The second chart presents the total number of sturgeon captured (by year, 2000-2004); the effort (sets/days), for these years, net mesh size, location, timing (tidal) and crew were very similar. The third chart includes the total Albion sturgeon catch data for 1980-1999 (unadjusted); data provided by Jim Echols. The effort in these years did have variations (sets/days, mesh size) so the numbers can not be used for direct comparisons to the 2000-2004 without adjustments and interpolation. Size data is not available for 1980-99. The FRSCS wants to acknowledge the high level of effort and professionalism provided by the crew of the Albion test fishery. Since April 2000, the crew, led by Al Baker and Kevin Buxton, has sampled (scanned for the presence of a PIT tag and measured) or tagged 2,162 white sturgeon, of which 319 (14.8%) were PIT tag recaptures. The total length of sturgeon sampled by the Albion crew in this time was 202,024 cm (2,020 meters - over 2 kms of fish!). That is a lot of work. And the crew of the Witch Doctor collect, manage, and transfer the data with attention to detail and a great attitude. It is a pleasure and a privilege to have them on the team. Troy C. Nelson |
 Greetings,